

How Many Days Does Thwarting Global Domination Take?
How Many Days Does Thwarting Global Domination Take?
How to get data driven time estimates for your work


In a slightly more tactical Tidbit than normal, I want to give you guys and gals a tool to estimate your work using data from your own workflows. A special thanks to Sonya from Nave for the inspiration on this one. I’ve been wanting to write this one for a while but her recent article gave me the right push.
Have you ever had someone ask you to make them a shoe rack for their closet? No? Well, imagine for a moment someone has asked you to do something that takes longer than just a few minutes. Maybe it’s cutting the grass. Maybe it’s taking pictures for a wedding. Perhaps, if you’re like me, you’ve been asked to infiltrate a secret society that is bent on destabilizing the global economy. Okay, so that may have been the plot to a Bond film, but the point is, at some point we have all been asked, at one time or another, to do something that will take time.
Now, have you ever been asked the dreaded follow-up question, “How long do you think that will take?” Again, I have, and my normal retort was, “That should take me a few days.” It turns out stopping the destabilization of world governments takes longer than a 65 minute runtime. So how can we get better at estimating stuff? I’m so glad you asked because in today’s Tidbit, I have a quick method for estimating that uses real data. My hope is it will help you not lie so much when it comes to calculating some great estimates and, instead, start making data driven estimates.
NERD ALERT! This does include some spreadsheet work in Google Sheets or Excel. You have been warned.
Lines, and Figures, and Bars, Oh My…
I am a hands on learner so I will guide you through a quick activity you can do yourself. You can literally use this exercise immediately at home or work and it only takes a few minutes. I’m including everything you need, so don’t sweat it if you are not a spreadsheet wizard.
Start by taking the last 30-ish tasks you’ve completed. If you have been reading the blog, you probably track your work using a Kanban board, so just open that and find the finished tasks. Now, open Excel, Google Spreadsheets, or Apple Sheets, whatever your spreadsheet flavor is, and list the time took, in days, to finish each task. No need to quibble over hours, just round to the nearest day and keep going. If something took less than a day, just call it one day. Again, I am a visual learner, so here is a screenshot for what you should have so far.
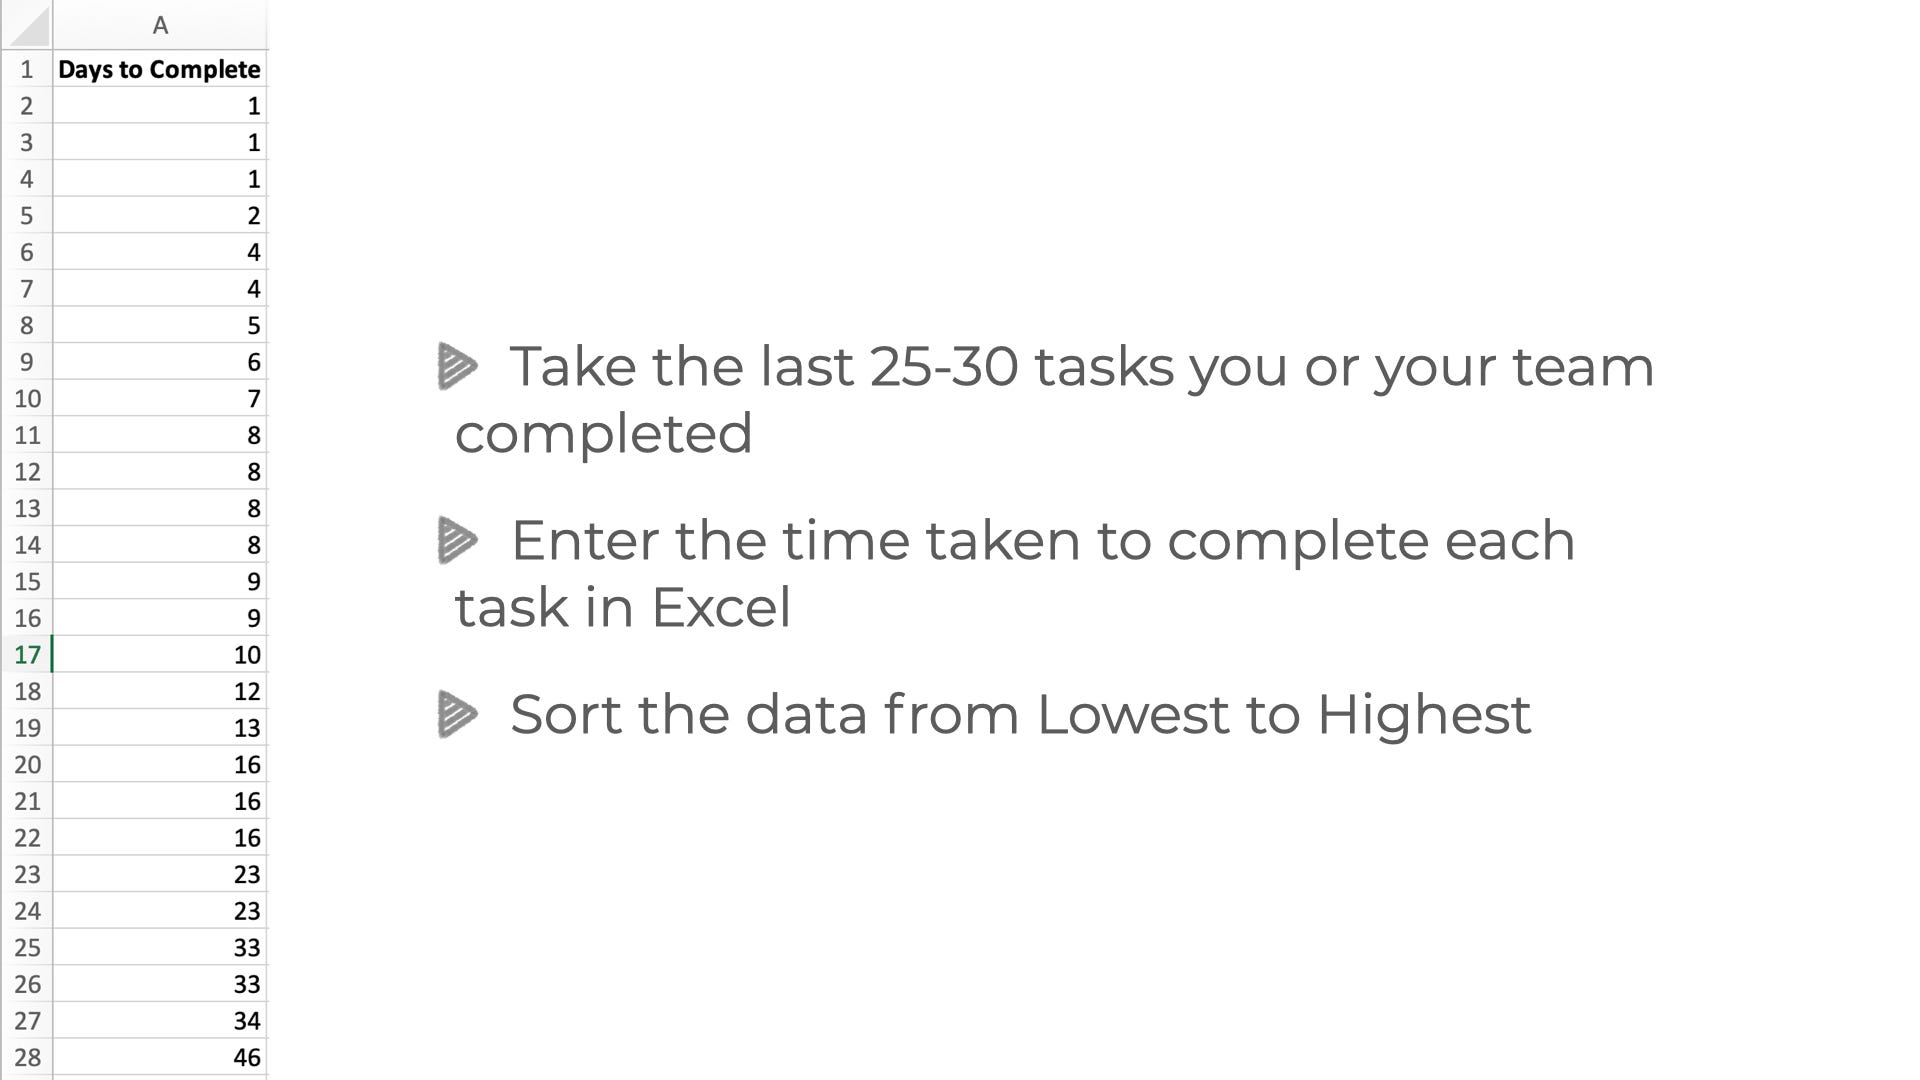
Once you list those tasks, sort the column from lowest to highest. This list will now represent your last 20 or so items (27 in our example) ordered from quickest to the most time consuming.
Now we do some calculation magic. My good friend Dustin Corey tells me, “If it happens by magic, you probably don’t understand it well enough.” That is why I will do my best to explain what we are doing along the way, without using words that will make your eyes cross.
In your spreadsheet I want you to add a table with 4 columns. In the first column, we just want to count the number of completed items we listed. In the second column, just type in 4 values - 50%, 70%, 85%, and 95%. We are going to use these to define the probability of your time estimates. Don’t leave! We are almost there! How about another screenshot, complete with formulas?
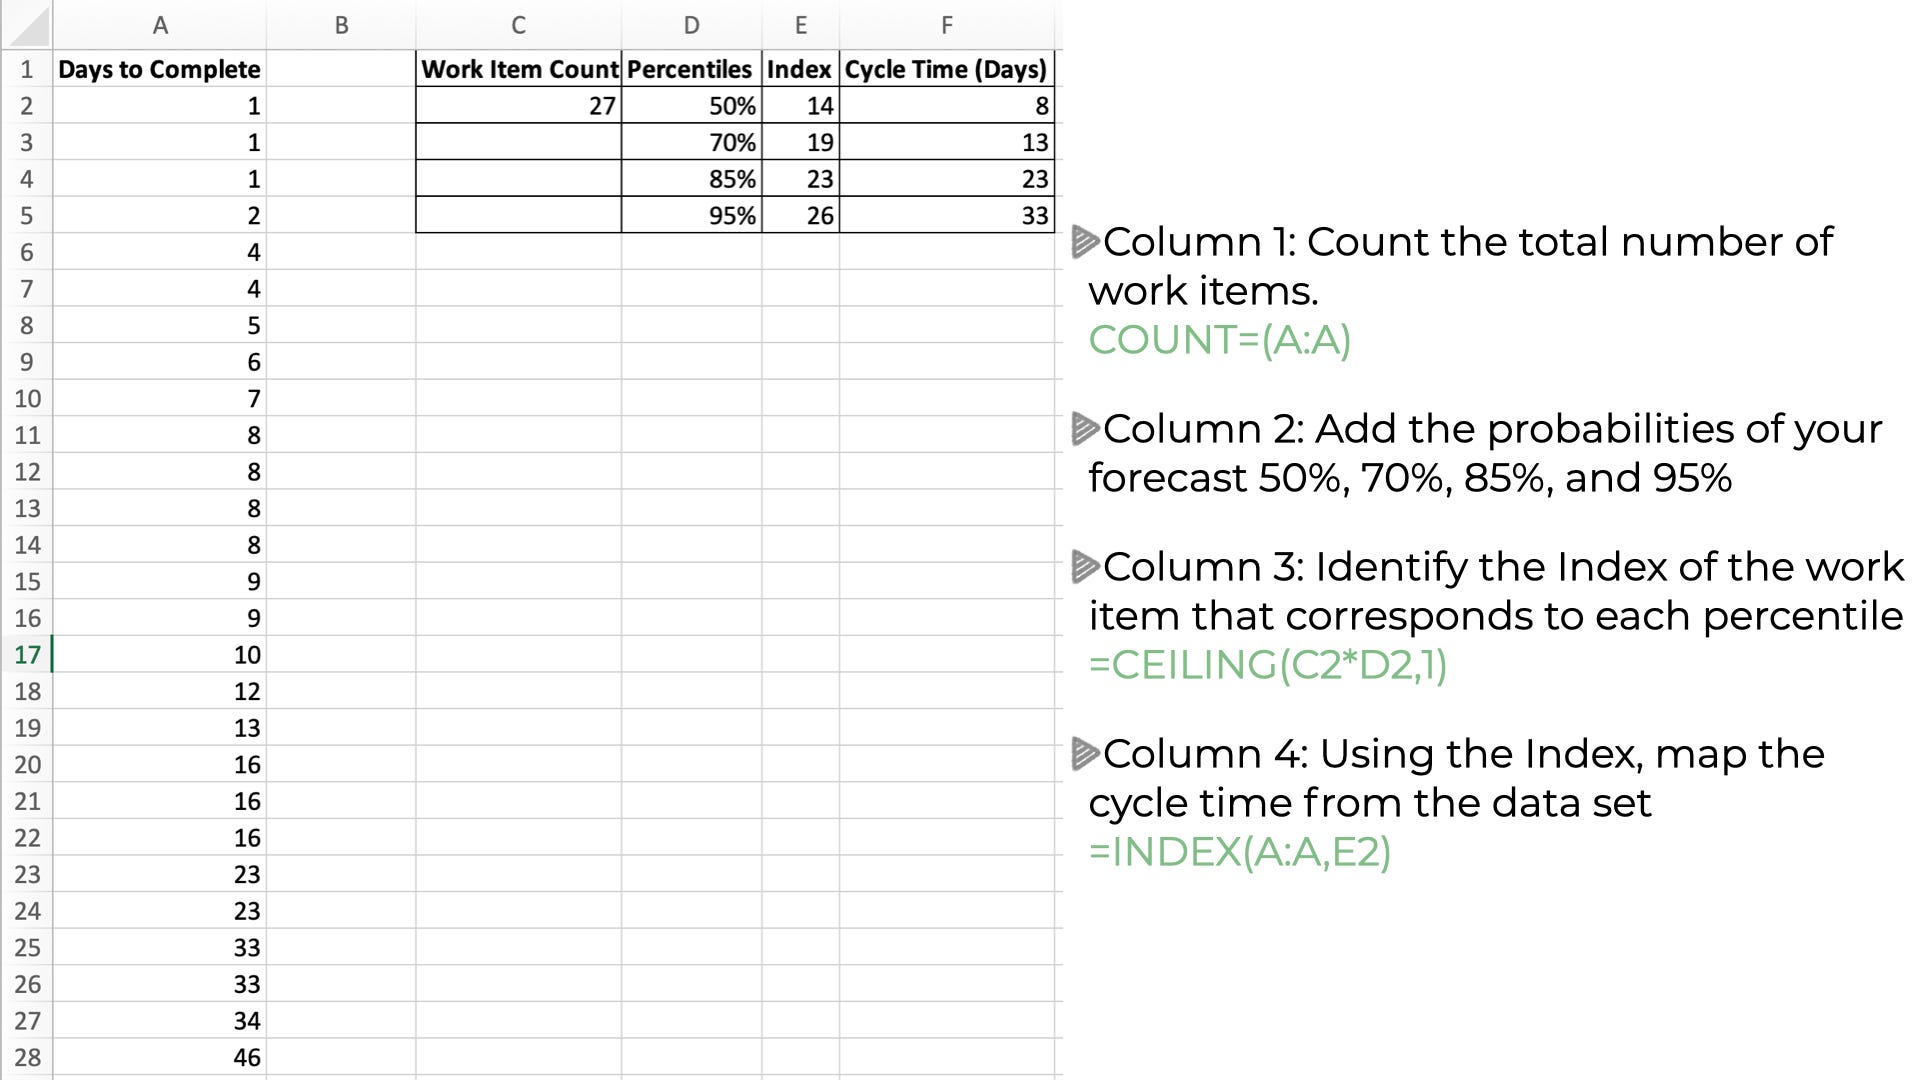
Now, in the third column, I want you to multiply the values from the first two columns so that we can identify the index of the work item that corresponds to each percentile. (See the formula in screenshot)
In the example above, the 50% corresponds to the item with an index of 14 (row 14), the 70% is the item with an index of 19 (row 19, you get idea now), the 85th is the 23rd item and the 95th percent is the item with an index of 26. (For those of you that must know, 100% would index at whatever the data point was in your list)
In the fourth column, we map the cycle times that correspond to the indexes we’ve identified.
You may be asking yourself, “Okay Tristan, how do I use this now?” Let’s walk the data. We know now that in 50% of the tasks we completed, it took 8 days or less to deliver the work. You can tell your curious leader there is a 50% chance we can build that shoe rack in 8 days or less. Yeah, that’s essentially a coin flip. Let’s keep looking.
We could also say there is a 70% chance we finish in 13 days or better, 85% chance we finish in 23 days or better, and 95% chance we finish in 33 days or less. And those are data driven dates as opposed to reckless, finger in the air guesses.
I’ll do you one better and give you the real golden nugget. You can also use this data to have a great conversation with your team. You could say, for example, “Guys, based on the way we worked the last 27 tasks, 95% of the work takes 33 days or less. How did we work during that time that, if we change, could drive that number down?” Perhaps you got stuck figuring out how many shoes should go in the rack. Maybe infiltrating the secret society was harder because you needed security clearance. Either way, having data opens all kinds of new ways to improve.
Epilogue
That’s it. You survived. If you followed along in your own spreadsheet, you now have a forecasting tool based on you or your team’s past performance. Without doing any discovery on your next mission or knowing the size of a task, you can now make a commitment and give a probability of meeting that commitment. And, again, if you’re like me you love empowering a team with the ability to make their own data driven commitments.
That does it for today’s Tidbit. It’s a bit more tactical than normal, but I hope you find it super useful. Just remember that commitments are not contracts. They are discussions with your customers. As you do the work you will get a better idea of how things are progressing. Just keep your customers and stakeholders in the loop and have the discipline to improve your process.
Until next time,
keep on learning. Keep on growing.